8 Reasons to use Google Analytics for your Business or Organization

Google Analytics 4 (GA4) is a powerful web-based monitoring tool offered by Google, that provides valuable insights to business owners about their website's users, visits, and traffic sources.
Google Analytics' interface contains ready to view, built in reports, while also allowing more advanced users to create specific custom reports.
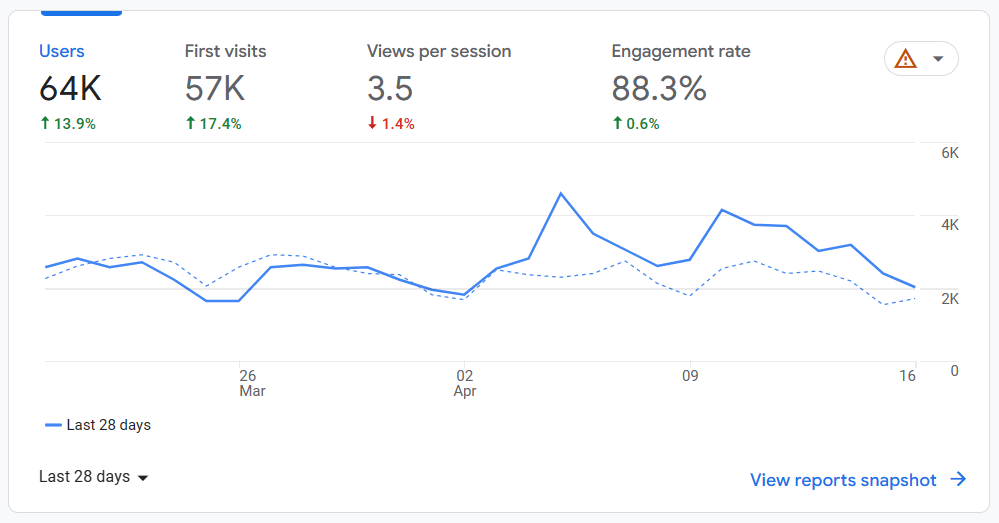
Google Analytics also allows you to quickly and easily select between seeing monthly (or weekly) graphs of your number of Users, First visits, Views per Session, or even your website's Engagement rate.

8 Reasons to use Google Analytics for your Business or Organization:
1. Understand which pages users are interacting with the most on your website.
You probably have specific pages that you want users to interact with, view, or sign up for products and services. Perhaps you have recently created new articles, or product pages, or service pages.
Google Analytics allows you to see how many users each of your most important pages is getting per month (or even last week), how long much time they spend on those pages (and other things).
One of the most important reports to look at to understand how users are interacting with specific pages on your website is the Reports->Pages and screens report.
You can then rank that report by most users, most new users, highest engagement time (and other metrics).
To get a break down of device category (using the + feature on the report), you could compare mobile users v.s desktop users for each page. There is can be a substantial difference between how mobile users interact with a page and desktop users. This is a good indicator of if your specific page design works well for mobile users, and they stay and interact with that page.
This page based information is useful and necessary for calculating conversion rate for for individual pages. This is important when trying to determine which versions of a specific page have the highest conversion rate (e.g. which version of a page creates more sales or sig-ups), so that the best alternative can be used (also known as A / B testing). Conversion rate will be discussed in more detail later in this article.
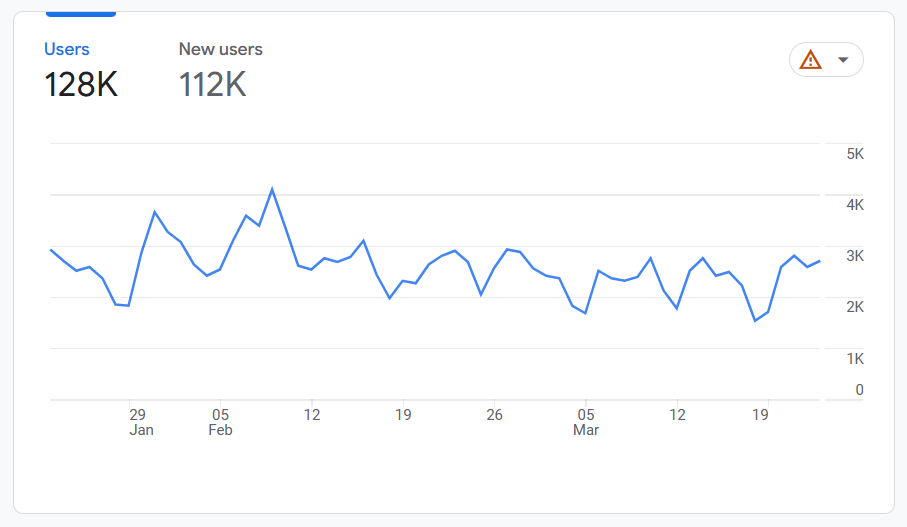
2. Understand how many users (or even new users) your site is getting every day.
Google Analytics lets you see how many users are using your website per day. This is displayed as a graph showing dates on the bottom of the graph, with the number of users (or even new users) your site is getting per day.

3. Understand your local traffic
If you have a local business then it is very useful to know information about visits from users in your particular city.
If your business mostly generates income from local sales then it can be useful to focus on metrics such as the visitor's indicated City/Town being the same as your city. Or perhaps the visitor's Country being the same as your Country, so as to better understand your website's performance specifically for those visitors.

Local traffic can be examined on a city level basis, regional or even on a country level basis.
Some metrics (such as average engagement time per session) we've found to be significantly different when looking at local city based traffic vs. all website traffic.
Example: Assume there is a local business that serves a local market such as service in that city. Average time per visit for all users could be 60 seconds (1 minute), and that can seem quite low, but when we look at only visits from users that Google has determined to be from that city, the average time on site could be around 240 seconds (4 minutes).
4. Understand which pages users are arriving on directly from the search engine results.
Using Google Analytics it's possible to get information about the very first pages users visit on your website and where that visit came from.
For example, a user sees a specific page of your website in Google's search results, then they click that link and arrive on a specific page on your website, Google tracks this information, allowing you to see the number of visits to that page from Googles search results.
5. Understand the routes that users take on your website.
Using GA4 Path Explorations,
you can see visualisations that show how users arrive at specific pages, and then move through
a series of pages on your website.
This is really useful to understand where users go to from specific pages.
For example,
where does most of your traffic go after arriving at the home page,
and then after your products page, to which products?
6. Understand your conversion rate
Conversion rate allows you to determine what percentage of users or visits to your website (or product landing page) take some desired action such as purchasing a service or product, or signing up on your website.
As you improve the quality of some of your pages, your conversion rate is likely to increase. This is a goal that can be worked towards, so it is important to know your current conversion rate for the specific page.
If you are testing an alternative design you may want to monitor the conversion rate for the new design and compare it to the current design.
Without Google Analytics: Without information about your number of visitors to your page or website, it is difficult to know what percentage of your visitors are actually converting to sales or sign ups, which is an important measure of how efficiently your website is working for you.
If you know your current conversion rate, you can also have some idea of what a rise in traffic would mean for sales based on your conversion rate.
Likewise, given your current traffic you can determine how sales would increase and the value associated with that if you increased you conversion rate to a higher rate e.g. from a 5 % conversion rate to a 10 % conversion rate.
Google Analytics can provide you with the information you need to know, such as users per specific product page per day, or all users for the whole website per day.
If you have a local business and Google supports this information of the city of your users (which it often does) you can get information about how many users from your city are going to your website per day or arriving at your product page per day.
Thus you can calculate a local conversion rate for your website (or product or services pages), without taking into account international users which may have had no interest in purchasing your products or services.
7. Understand your traffic from sources from Instagram, Facebook, organic traffic, direct traffic, and paid sources interact with your website.

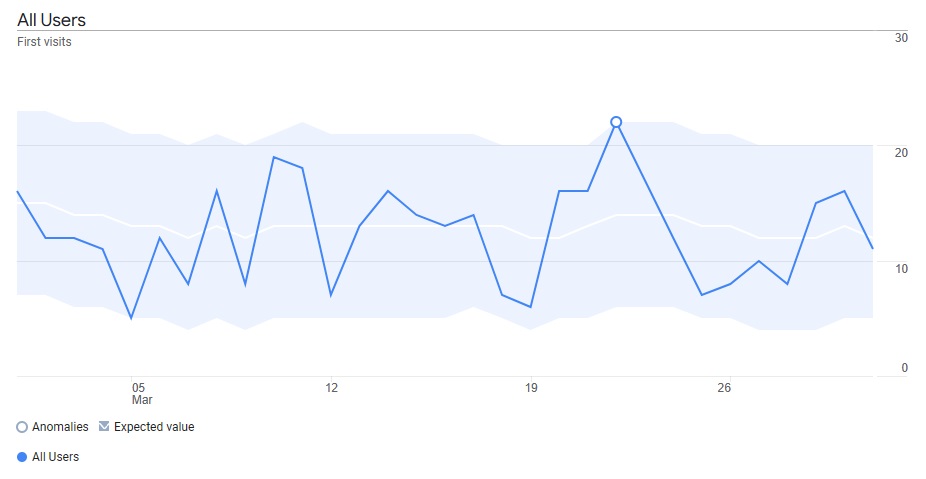
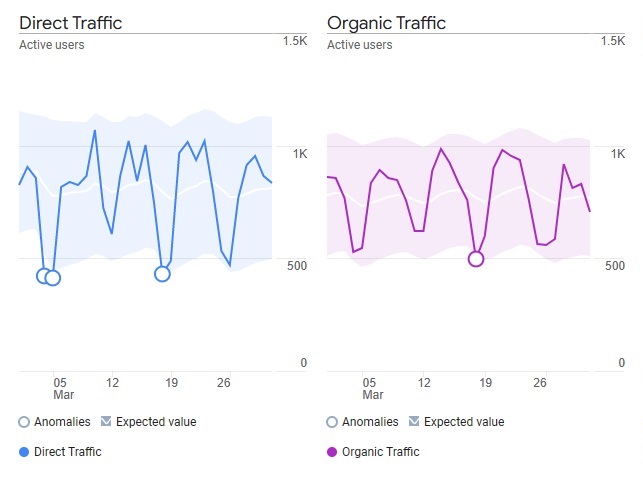
A series of graphs can be displayed together, showing an important metric such as Active users from Instagram, Facebook, direct traffic (when users directly type in the site's link for example), and organic traffic (clicks from search engines), and even paid traffic (such as from adverts showing at the top of search engine results that you are paying for).
Like the above graphs, additional sets of graphs for each of those sources can show you other information (or metrics) such as:
- how many page views each user on average makes on your website before leaving (This is known as page views per session).
-
how long each user on average is spending on your website
before leaving
(this is known as "average engagement time per session"). - how many users view your Services or Products page.
-
how many specific conversion events occur,
such as product views,
or
purchases,
sign-ups,
or even custom events can be setup up.
This information about your traffic sources is really useful, to see at a glance how your vistors are behaving coming from different traffic sources, each day, or week, especially if you've been actively promoting your business or services on social channels, or paying for advertising.
Note: These graphs (separated into direct, organic, Instagram and Facebook), don't come standard with GA4, but we can help you set them up, for example using Custom Exploration Reports, and thereafter, you can view them any time, and for any date range within the last 2 months.
8. Understand how users move through your sales funnel.
GA4 allows you to specify a series of pages that are part of your sales funnel on your website.
A sales funnel could be your Product page, then your Check-out page where a user enters their payment details, then finally the Payment Completed page where the user arrives at once they've completed payment.
You can then monitor number of users that make it to each step of your funnel, from which Funnel explorations also displays the Completion rate for each step.
Google Analytics 4 has a trended funnel graph that allows you to see how many users arrive at each part of your funnel over time. This is of course useful if you make improvements to pages in your funnel and want to see the effects over time.
Funnels can also allow you to see how different devices (such as desktop, tablet or mobile devices) perform for each step of the funnel.
Get Started now!
If any of these kinds of reports interest you, we can assist you in setting them up quickly and easily.
Features Demonstration
We can also demonstrate and take you through using GA4 if you are new to the various features or would like to see more advanced reports, using your own data, or with Google's GA4 Demo account.
We can assist with creating these reports for you
If you have already got GA4 installed, contact us for arranging next steps.
You can add us as a "Editor" under you specific website "domain property", which will allow us access to your data so we can create these reports to save you time, or even just discuss the data with you and what various metrics mean and what some of the potential implications are.
GA4 Installation
If you do not have GA4 installed, we can help you do that and get you started.
Once various reports are setup, you will have them ready to view or update, without any additional cost, at any time, allowing you to choose specific date ranges for the reports (any range within the last 2 months).
Access
After the specific reports and graphs are setup and accessible to you, you can remove our access to your account.
Confidentiality and Non-Disclosure
We will keep your information private and will not disclose any of your analytics information to any third party.
Get Started
Would you like us to help you quickly create these reports, go over your analytics data with you,
or set up GA4?
Read more about our services and rates,
or specifically our GA4 Analytics Analysis services we offer,
or contact us now.
