Useful GA4 Metrics to Monitor
Entrances - The number of times that the first event recorded for a session occurred on a page or screen.
A user generates one entrance each time they begin a session on your website, and that specific page will have an entrance associated with it.
Entrances occur when a user arrives at a website via a link, or from search engine results, or having entered in the website address in the URL bar of the browser.
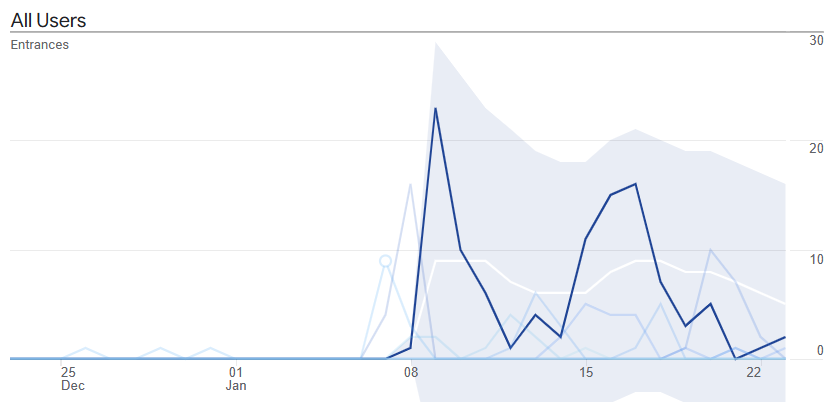
Entrances can be useful to monitor when sharing a link on a website or on social media, to see how traffic directly arrives at the specific page.
Organic Entrances (entrances specifically from search engines) can be useful see which pages on your website search engines are driving traffic to. If important pages on your website are not generating organic entrances this could be due to lack of quality copy on the specific pages (and other factors).
When sharing a link to a specific page on your website (on social media for example) you can see peaks in a time based Entrances graph (see image above) where people click the link and arrive at the website. A link to a specific page could be shared in various locations over time, and when a sufficiently large audience sees a link for the first time and click on it, a peak in entrances can be noted.
Note that there is also a Landing Pages Report that GA4 provides that can be found under Engagement > Landing Page, that for each landing page, it includes numbers for Sessions, Users, New users, Average engagement time per session, with a time based graph. Clicking on the "order by arrow" preceding the column title in the report will order by this column but also show a time based graph for the metric.
First visits - The number of times users opened your website for the first time.
When a user arrives at your website for the first time, that page that they land on will have a first visit event associated with it.
First visits are similar to entrances but different -
A user only generates one first visit, and that first visit will be associated with
the specific first page they view.
A user generates one entrance each time they begin a session on your website, and that
specific page will have an entrance associated with it.
First visits can be useful to see
which pages users are first arriving on your website.
A time based graph showing first visits over time can be useful to see new people arriving on your site on specific days.
These time based graphs can either just show all first visits to the website, or actually break it down and show the top pages
all as separate lines on the same graph.
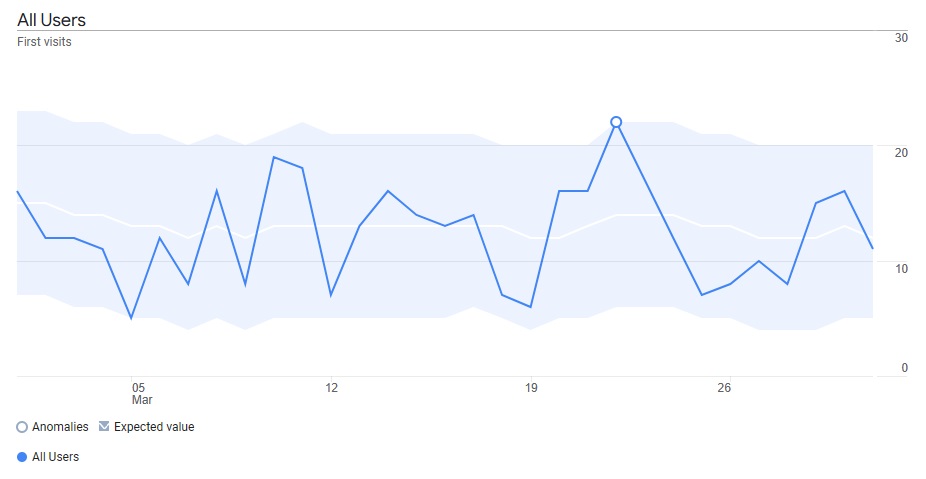
First visits - The number of times different users opened your website for the very first time (as far as Google Analytics is able to detect). E.g. 10 first visits on a day would mean that 10 different users arrived at your website for the first time.
First visits is also an important metric to compare to different segments, such as compare first visits coming from organic, direct, and social media sources and see which pages are producing the most first visits from each source.
A time based graph, showing only organic first visits, from search engines (like Google), showing which top pages on the graph which are generating traffic to your site, can be useful.
If you have important content pages that you want people to click through from search engine results to your website, then it can be useful to monitor only organic first visits, using graphs to see if users are reaching those pages and how often, or if you prefer, a table that shows the number of organic first visits for each page over the time period.
Views - The number of page or screen views for each page.
Each time a user views a page of content on your website, a view is being generated with Google Analytics.
Views can be very useful to see the kind of content that users are most interested in on your website. Topics with the highest views can be an indication of the kind of content users are interested in and can guide the choice of content on your website.
Views per session - The number of page or screen views that take place on average per session.
Technically calculated as the number of page or screen views events divided by the number of sessions.
Views per session is an important metric to monitor over time for a website to understand how many pages on average a user is viewing during a session, it can be useful to know how this is changing over time.
This metric can be viewed on a time based graph, by week, to look for trends.
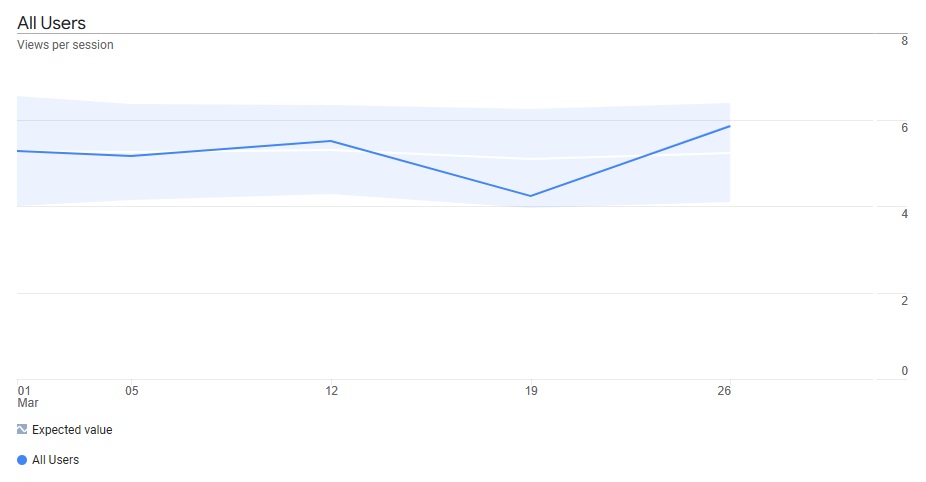
Views per session - The number of page or screen views that take place on average per user's session. As significant changes to a website are made, you may notice changes to the views per session.
Various traffic sources such as direct traffic, organic traffic, and traffic from different social media sites can have their views per session compared with each other.
Active users - The number of distinct users that accessed your website or app.
Active Users can be thought of as the number of users on the page or website (depending on the reporting criteria), that did some activity during the specified time range.
Technically, an Active user is any user with a engaged session or who triggered a first visit or first open event, or that triggered a user engagement event that passes a time parameter within the date range - E.g. the page being open for longer than one second generating a user engagement event.
In general, the term "users" with regard to GA4, it is Active users is that is being referred to.
A time based graph showing Active users for a set of pages can be a useful graph to see the number of distinct users that are engaging with various pages over a time period.
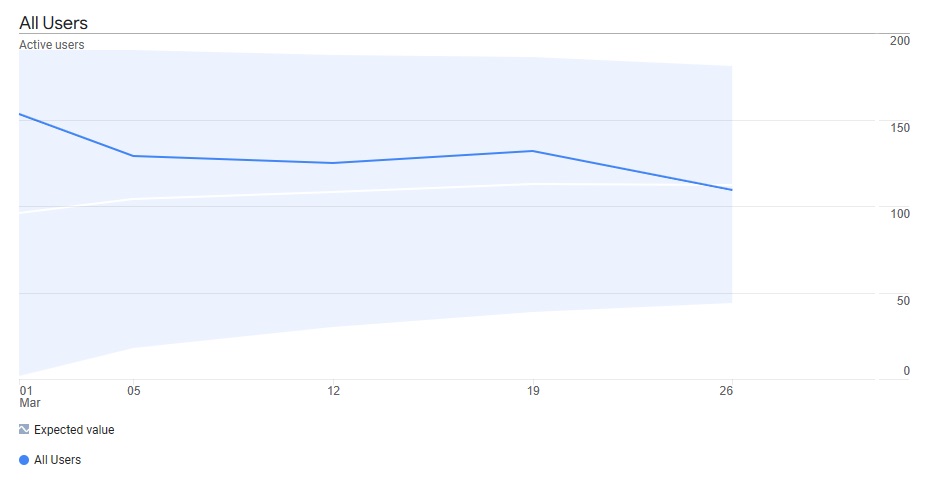
Graphs of most metrics (e.g. Active users) can be set with each data point representing totals for each day, or each week. You can choose whichever is more useful in a particular situation.
A note about distinct users in the real world: On one day a person could access your website through their desktop computer, and later in the same day with a different device, such as their mobile phone or tablet. If the user is not logged into Google, then Google may have no way of knowing that it is the same user, so 2 users could be recorded (even though in reality it is only one user for that day).
Views per user - The number of page views per user.
Views per user can be useful to see how many views a page gets for each user.
If the content is useful enough to be visited multiple times by the same users then views per user will be higher for the page (or website).
New users - The
number of users that interacted with your website (or app) for the first time.
(Technically, the number of unique users that have logged a first open or first visit event).
New users is a useful metric to see that you're reaching a new audience.
It is useful to see New users on a time based graph to
see a website's exposure to new people over a date range.
Returning users - the number of users that returned to your website. (Users who have created at least one previous session)
Returning users helps a site owner (or content producer) see if the content on the site is useful enough to for users to return.
It is also of course useful to compare the ratio of returning users to active users, to see what ratio or percentage of users are returning users.
Engaged sesssions - Sessions that last 10 seconds or longer, or had 1 or more conversion events, or 2 or more page or screen views.
Engaged sessions can be contrasted with All sessions. Comparing Engaged sessions to All sessions brings us to a useful metric in one number - Engagement rate (below).
Engaged sessions can help us see that users stayed for a time and / or interacted with the site (instead of leaving after a few seconds).
Setting a custom engaged session time -
For some content based websites like informational websites or blogs, an engagement of 10 seconds doesn't really
conceptually indicate an "engaged user", because knowing if the user only viewed the page for 10 seconds or not, may not be enough to tell
if the content was engaging, or whether they stayed long enough to get value out of the content the page.
For this reason you can manually adjust the timer for engaged sessions to something other than 10 seconds,
for example 20 seconds, or 60 seconds,
or a duration that better suits what you consider to be a better indicator of whether the user is engaging with content on your website.
Then GA4 will then trigger an engaged session after that time delay instead of the 10 seconds which can be more useful.
Be careful to note the date you change this setting, as your engagement rate will be re-defined from that point onwards,
and could therefore decrease as a result of the new way it is being measured.
Find the setting here (Adjust the timer for engaged sessions):
ADMIN > Account Settings > Data Streams > (Select the website Data Stream) > Configure tag settings >
(Settings Panel) > Show all (top right of panel) > Adjust session timeout > Adjust timer for engaged sessions
(change the timer from 10 seconds to a different value)
Engagement rate - The percentage of all Sessions that were Engaged sessions.
Engagement rate can be useful to see if the content engages the user,
causing them to trigger an engaged session (e.g stay 10 seconds or more on the page, or create other conversion events
or screen views as described above in Engaged Sessions).
Pages with poor engagement rates may need improvement.
After upgrading a page, you can monitor how the engagement rate changes over a time graph for a particular page. Likewise, after upgrading a site you can monitor how engagement changes over a time graph for the whole website.
Engagement rate graphs can be made for a whole website monitoring the average Engagement rate over time.
Engagement rate can be thought of as a kind of opposite (or inverse) to Bounce Rate.
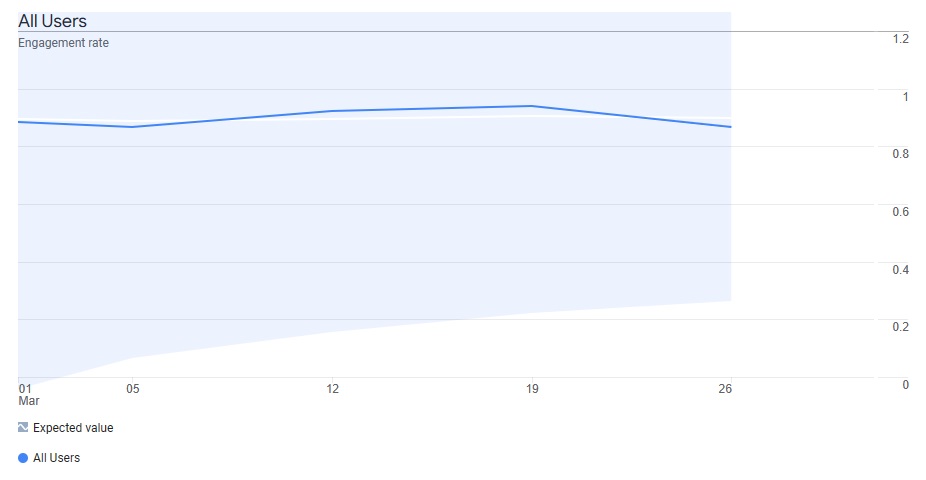
Bounce rate - The percentage of sessions that were not engaged sessions.
If someone were to arrive at a page on your website from a link and leaves in less than 10 seconds and doesn't click on anything else or trigger any other events, this would count as a bounce and bounce rate will increase for the page (as well as for the site as a whole).
High Bounce rates pages can help us see which pages potentially are creating a poor impression on the user, causing them to leave without much interaction.
Note that Engagement rate can be monitored instead of Bounce rate.
If a page has a 75% Engagement rate, it has a 25 % Bounce rate.
If a page has a 25% Bounce rate it has a 75% Engagement rate.
Each metric directly tells us about the other.
Engaged sessions per user - The average number of Engaged sessions per user.
Engaged sessions per user could be another useful to see how visitors are interacting with, or returning to your website over a time period. As a user interacts more with your website over multiple sessions, they will increase the Engaged sessions per user.
Average engagement time - The average time that your website was in focus in a user's browser,
or the app was in the foreground of a user's device.
Average engagement time = Total user engagement durations / Number of active users.
Due to the way Average engagment time is calculated (shown above), it may be better to call it Average engagement time per user.
Average engagement time can be useful to see how long users are spending on average on particular pages or on the whole website.
Average engagement time per session - The average engagement time per session.
GA4's built in Engagement > Engagement overview report
displays a time based graph showing
Average engagement time as well as
Average engagement time per session.
Clicking on the either term above the report will show the graph for that metric.
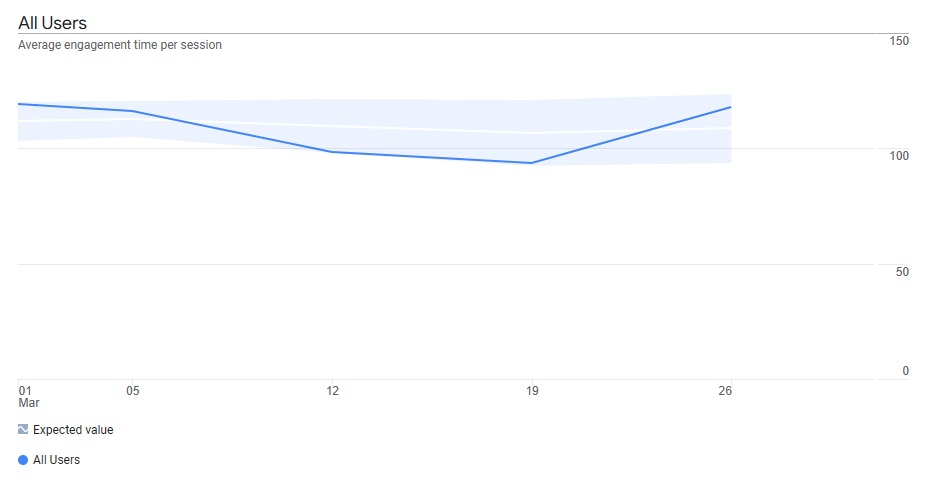
Here we can see the visit time for Seattle indicated visitors is around 90 to 120 seconds (1.5 to 2 minutes).
Exits - the number of times that the last event in a session occurred on a page or screen.
It is useful to compare Exits to Sessions to get a feel for how much of those sessions have an exit on a particular page. This can be thought of as a kind of "Exit Rate" for a particular page and is useful to monitor and see which pages are producing the highest ratio of Exits to Sessions, depending on the kind of page, it could be a focus for improvement.
Exits vs Sessions Exploration Graph Report and Scatter Plots (advanced)
While you can compare Exits to Sessions in a table, it really useful to use an Exploration Report that shows both variables on a single graph.
This can be done showing many pages on a single graph, where each page is a
point (small circle) on the graph, where the position of the point is determined by Session and Exit Rate.
Horizontal position of a point = number of Sessions
Vertical position of a point = number of Exits
This is called a scatter plot and is one of the features of Exploration Reports.
Pages with unusually high or low ratio of Exit Rates to Sessions, will stand out from the others on this kind of graph.
A general gradient or line of points often appears, and shows the average Exits to Sessions as kind of
visual gradient (points outside of this gradient, have Exits to Sessions outside of the average).
Technical Note and Example for Scatter Plot -
Use Page Title as the Dimension, and Sessions and Exits and the two values for the report, first
column being Exit Rate, and second column being Sessions (the graph seems to use, first column as "horizontal axis" and second column as
"vertical axis"). After the table is displayed, then change the display method to Scatter Plot.
Time Based Graphs
Graphs showing how one specific metric changes over time for a set of pages (or the entire website), can be very useful.
Time based Graphs are displayed for various metrics with GA4's built in reports but are also available within GA4 Exploration Reports for any specific metric you may want to monitor.
The screenshot of the Entrances graph image in this article is an example of a time based graph in a custom Exploration Report, showing the number of entrances for various pages (focusing on one particular page that has been selected).
About these metrics
The above metrics on this page can be shown for each page of the website, where each row in the report represents a
page for example. However, these metrics can also be looked at for the whole website
without focusing on individual pages.
Note that Some of some of these metrics may only be accessible
through the Exploration feature of Google Analytics 4, where custom reports are created.
Contact us
If you would like us to assist in setting up Google Analytics 4 or creating special reports, such as time based, or country based reports for various pages and metrics, or insights into interpreting this data, please contact us.
Disclaimer
Use the information on this page at your own risk, no warranty about the accuracy of the information is given or implied. While we have taken care to provide accurate information on this page, we cannot guarantee the information on this page is error free. Use it at your own risk.
Sources
Google Support - Session Metrics and Other Metrics on this page:
GA4 Analytics dimensions and metrics - Sessions Section