Services
We offer the following primary services:
Analyse your website
Change or update your website
Change or update the design of your website or add features using mobile compatible HTML5 and CSS, or add content.
Website development and Internet based solutions
Create a specific system, function or tool. We develop Internet based solutions for select clients. Specialising in HTML5 / CSS website front-end development, with C# ASP.NET and SQL Server databases for back-end development.
Analyse your Google Analytics
Analyse various Google Analytics metrics for your website, to better understand your users and traffic sources, conversions, and to determine where to focus time and resources for improving or adding to your website.

GA4 Analytics Analysis
We can examine various Google Analytics metrics on your website to better understand your users, your traffic sources, and help guide informed discussions on where your site could be improved or what sections or topics could be focused on next.
City Based or Country Based Reports
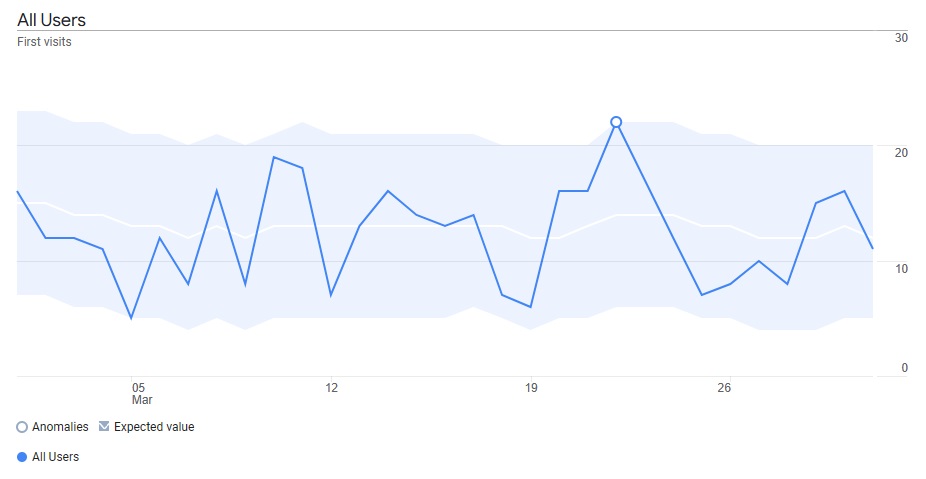
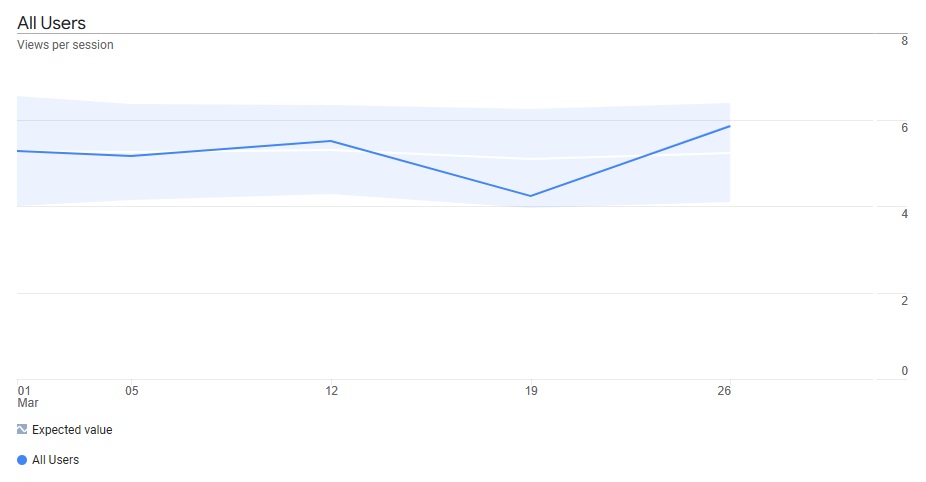
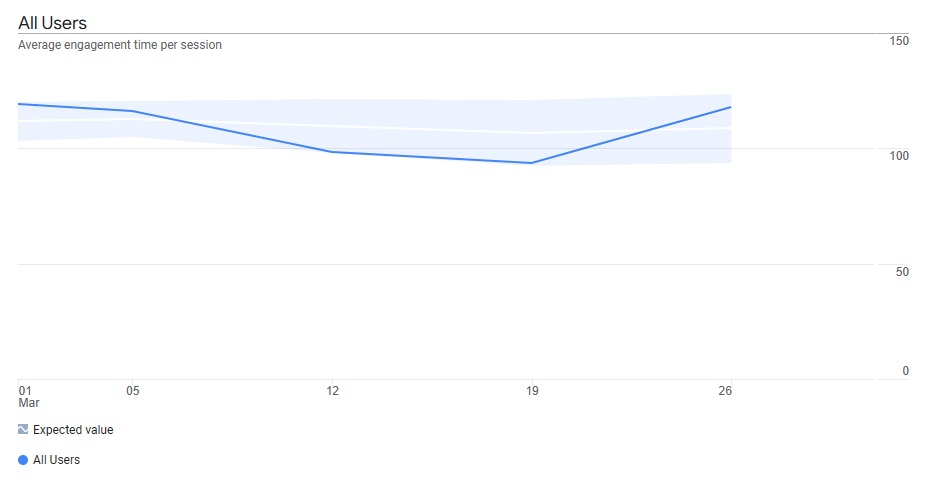
If your business or website serves a local market, or specifically a city, we can provide a city based, or country based an analysis of your key Google Analytics 4 metrics, such as daily users, first visits, average engagement time per session, views per session, number of sesssions, and engagement rate for your location. (provided that Google Analytics 4 supports your specific city in the Analytics - our experience is Google seems to support most major cities)

First visits - The number of times different users opened your website for the very first time (as far as Google Analytics is able to detect). E.g. 10 first visits on a day would mean that 10 different users arrived at your website for the first time.
If you have a local business and view the default metrics provided by GA4 which in general includes traffic and metrics from other countries and areas, this can give an unrealistic view of your actual users that may be wanting to do business with you, and how they're interacting with your website.

Views per session - The number of page or screen views that take place on average per user's session. As significant changes to a website are made, you may notice changes to the views per session.
We can provide both metrics for the performance of users on the whole website for a specific country or city, as well a metrics for each individual page, but only taking into account users in that location.
We have seen radical changes in metrics for local businesses, when you only viewing information about users from the specific city or the business, instead of all traffic.

Here we can see the visit time for Seattle indicated visitors is around 90 to 120 seconds (1.5 to 2 minutes).
Events and Conversion Tracking
We can help you track specific events on your website such as product or service views, checkouts, and purchases, and understand which events such as purchases come from certain traffic sources, such as directly from links, from search engines like Google, or from social media posts that convert to sales. This allows you to understand your spend and the results it's generating.
We can show you the numbers for each type of conversion by traffic source
within a specific date range.
Time based graphs for specific events or metrics monitoring
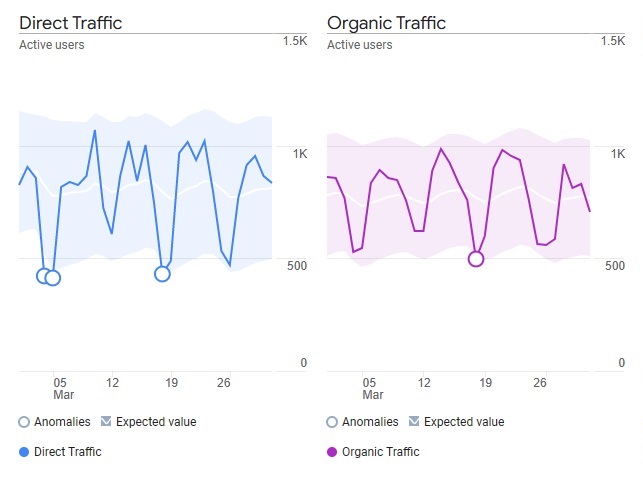
We can also show you graphs over a time period showing the numbers of events on each day, views to specific pages, product views, completed purchased, or other events of interest.
We can help you display your Facebook Traffic, Instagram Traffic, direct and organic traffic into separate graphs, monitoring a metric like Active users for each day, for each of these sources.

Traffic Sources Comparison
We can also help you monitor direct, organic traffic, Facebook, and Instagram traffic over other key performance metrics, for each of your pages, over a specific time period.
For each traffic source, (and optionally for certain important site pages), we can monitor metrics such as:
Monitoring the number of organic traffic entrances to specific pages from search engines like Google, can be useful to know, helping to understand where content could be added to encourage Google to rank pages these pages higher in the search engine results to get more direct clicks to those specific pages.
Custom Exploration Reports
We create custom Exploration Reports allowing you to quickly and easily see reports on key metrics and key pages, that can be checked any time with your latest analytics data (at no additional cost). These include your stats on your top landing pages, landing page graphs over time, new and returning visitors, engagement information for various pages, pages with high exists, traffic sources, scatter plots for key metrics to easily see pages that are outliers from the average.
See the resource we created detailing useful GA4 metrics to monitor on a website.
User Path Analysis
Using GA4 path explorations we can graphically show you the paths users travel on your website, relating to specific pages of interest. See the paths users makes from your home page to other parts of your site, or to or from any specific pages of interest.
Funnels Analysis
If you have specific funnels that that are part of a purchase (or sign-up), for example viewing a range of products / services, then a specific product / service, then checkout, then payment, we can help you setup GA4 funnel explorations to monitor the conversion rate for each step of the process.
If a specific part of the funnel has a low conversion rate, we can then use that information to help understand that it may be possible to improve the step or other steps in the funnel, to improve the conversion rate.
Setup GA4
If you do not have Google Analytics 4 installed, we can also assist with setting up the necessary accounts, properties and tags for your website.
Reports Assistance
If any of these kinds of reports or features interest you, we can assist you with setting them up quickly and easily.
If there are specific pages or events that you want to track, please contact us to discuss these, we can help you create whichever specific reports you think are important.
If you already have installed GA4, contact us for arranging next steps,
you can add us as a "Editor" under you specific website "domain property".
We can then create these reports for you to save you time.
If you do not have GA4 installed, we
can also advise on how to get you started with GA4.
If you like, we can also demonstrate and
go over any meanings behind the
specific data or metrics, and or reports
over a zoom session.
Once the various reports are adequately setup you can
remove our access to the account, and then you will have the reports ready to view or update,
date ranges as you need to.
If this sounds good then, and perhaps you have questions you would like us to go over, either way, let's get started now.
See our hourly rates.
Website Development and Internet Based Solutions
With 15+ years experience in website development, whether you are a new business wanting to get online for the first time with a fast, professional, secure, mobile compliant website, or a business that is been operating for many years, we can help your business reach its online objectives.
We can provide custom solutions according to your requirements.
Our solutions include database enabled websites, data storage, update and visualization.
When we build new websites or solutions for clients, we take and use a graded approach, making sure that the most important things are covered first, representing your brand in a professional way. If it is a new business we can help get your business online and register it with Google (if necessary), so that it can get be found when people search for it.
Unless requested, we don't use third party tools or components during the development of our websites. We use clean, light, fast-loading HTML5 with CSS, or C# ASP.NET with Master Pages. This means we can trust the basic content pages will be highly secure and not have potential vulnerabilities that can be introduced when using tools or templates written by other parties.
We also can update an existing website's design or adapt the website's CSS or HTML to create new features, or create new pages.
See our hourly rates.
Hourly Service Rates
For convenience you can select an appropriate currency for our hourly rates below:
USD ZAR
Service Rate for Website Development / Website Changes / Software Development / Internet related / IoT Work
Website Development, Software Development, Internet related work, or IoT work is done on a R 350 per hour basis.
Service Rate for Website Analysis and Google Analytics related Work
All Google Analytics related work is done on a R 350 per hour basis.
Recommendations and Changes
We use our experience in the industry to make our best recommendations for changes to your website or domain.
Note / Disclaimer
DISCLAIMER: By using our services you will need to agree that all recommendations are accepted at your own risk, and all changes to your domain are done at your own risk, you will need to accept that we will not be held liable for any results of these recommendations or changes. Such negative issues we believe to be very unlikely, but we need to offer our services, being protected should issues occur at a later stage for any reason, including issues that may occur at the hosting company's side, which we have no control over.
If you're interested in any of the above services to improve your website, please
Contact us.
Contact us